Key Performance Indicators, or KPIs in short, are widely used in the business context. The most famous book describing KPIs and their related Objectives and Key Results, or OKRs in short, is Measure What Matters by John Doerr.
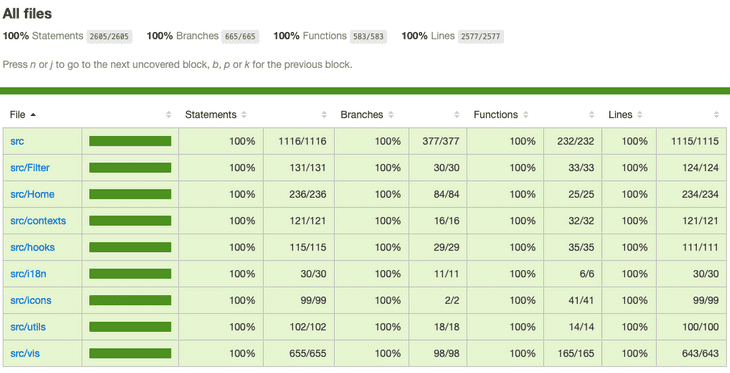
Nowadays we even have KPIs in the technical context. Managers and Executives love dashboards but also for us engineers they play an important role during the development. For quite some time we had one of the most important KPI, namely code coverage. Code coverage is a good indicator for the quality of your code. It's also a really good start to get into technical KPIs. The higher the coverage the better your code and the easier it is to refactor parts of it. At the same time it shows the ability to slice your application into multiple layers as you're able to test them independently.
However, as we learned in the past, code coverage is not enough. There are plenty of KPIs that we need to track in order to deliver a performant and high quality solution. Here is a list of KPIs we came up with. Those KPIs aren't bound to any technology or programming language. They are more or less the same, whether you're building a native mobile application, a web application with backend and frontend, an embedded application running on a real time operating system (RTOS) or even a native windows application.
- Code coverage
- Bundle size
- Build time
- Lines of code
- Number of dependencies
- Docker image size
- Benchmarks
- Static analysis, e.g. cyclomatic complexity
- Quantitative insights, e.g. activity, churn code, ownership, pairings, pull requests open, retention, time to merge
- Memory usage
- ... and many more
Since we have plenty of KPIs we also have plenty of options to track those. However all companies from the following list focus on very specific use cases. Some do code coverage, some do analysis, some do size and some do dependencies.
- coveralls (code coverage)
- codecov (code coverage)
- codeclimate (insights)
- sonarqube (quality)
- ...
There is no one size fits all. All of those services have different badges. Nowadays we even have badge aggregators like shields.io to consolidate all the information coming from different providers into a standardised look and feel.
KPIs for web apps
There are even more KPIs depending on your type of application. If you're writing a web application that will run in the browser you should keep an eye on your Lighthouse score. Lighthouse ranks your site in the categories performance, accessibility, best practices, search engine optimization and progressive web application. The lists consists of many more items but here we show only a smaller selection.
-
Performance
- First Contentful Paint
- First Contentful Paint
- Speed Index
- First CPU Idle
- Time to Interactive
-
Accessibility
- Contrast
- Tab order
- Interactive controls
- User focus
- ARIA roles
-
Best Practices
- HTTPS
- HTTP/2
- HTML doctype
- Image aspect ratio
-
Search Engine Optimization (SEO)
- Document has title
- Document has meta
- robots.txt is valid
-
Progressive Web App (PWA)
- Fast and reliable
- Installable
- PWA Optimized
The Lighthouse metrics are a good start to gain insight into the performance of your web application. However Lighthouse loads pages in a simulated environment without a user. Those values might not be representative enough for the user experience in the field. That is why Google introduced some more KPIs to make sure they express the final user experience. They call those essential metrics for a healthy site the web vitals. They are split into two categories, the core web vitals and other web vitals. Core web vitals are Largest Contentful Paint (LCP), First Input Delay (FID) and Cumulative Layout Shift (CLS).
Other web vitals are First Contentful Paint (FCP), Time to First Byte (TTFB), Total Blocking Time (TBT), Time to Interactive (TTI). To learn more about those metrics and how to track them check out their blog post Introducing Web Vitals: essential metrics for a healthy site.
Real world examples
As we learned there are plenty of KPIs we should track on every commit. How are different projects doing this at the moment? Let us have a look a three projects already tracking their metrics during development. The first one is Deno, a secure runtime for JavaScript and TypeScript. The second one is Rust, a language empowering everyone to build reliable and efficient software. Last but not least we take a look at Memfault, a company that can automatically catch, triage, and fix issues on any hardware platform.
Deno
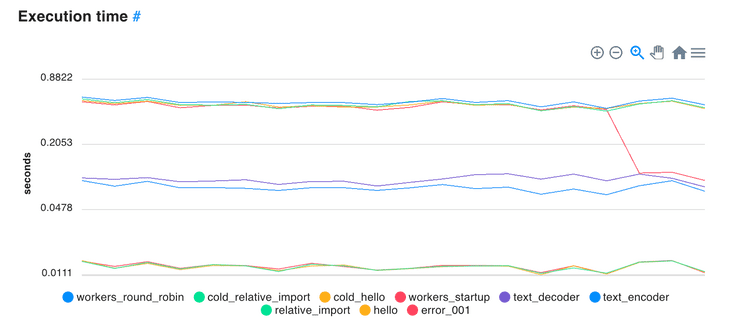
Deno runs its benchmarks on every commit. The project tracks runtime metrics, I/O and size over time. They do not explain how their solutions is built but it looks like a custom solution designed especially for their needs.
-
Runtime Metrics
- Execution time
- Thread count
- Syscall count
- Max Memory Usage
-
I/O
- Req/Sec
- Proxy Req/Sec
- Max Latency
- Throughput
-
Size
- Executable size
- Bundle size
Rust
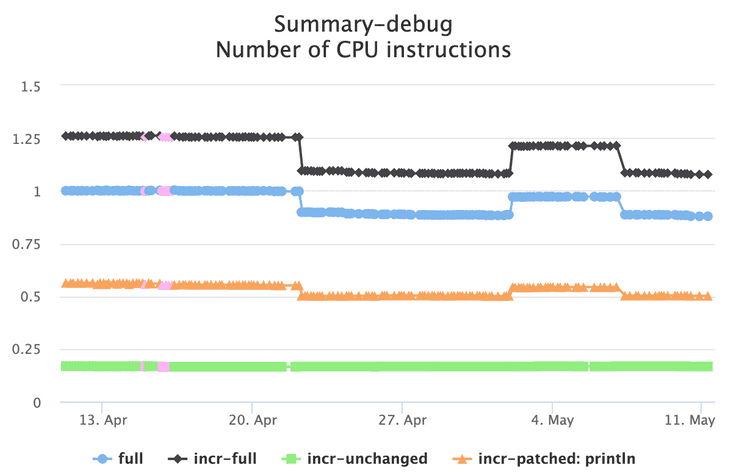
Rust is a language empowering everyone to build reliable and efficient software. They have a huge number of tests and run several benchmarks against them. Those benchmarks are tracked for every commit. The benchmarks include async/wait calls, code generation, deeply nested operations, encoding/decoding, futures, regular expressions, serialization/deserialization, unicode and rendering. For all those use cases they track the following values.
- Number of CPU instructions
- Wall time execution
- Faults
- Maximum resident set size
- Task clock
If you're interested in the results have a look at their live benchmarks. Rust uses a custom built solution. They use a dedicated repository rustc-timing where they store all the values in the JSON format. So every commit in their main repository creates another commit in this separate repository. They access and display the data using a custom designed web application living in a third repository rustc-perf. It works great for them and using GitHub as a data store is a very creative solution.
Memfault
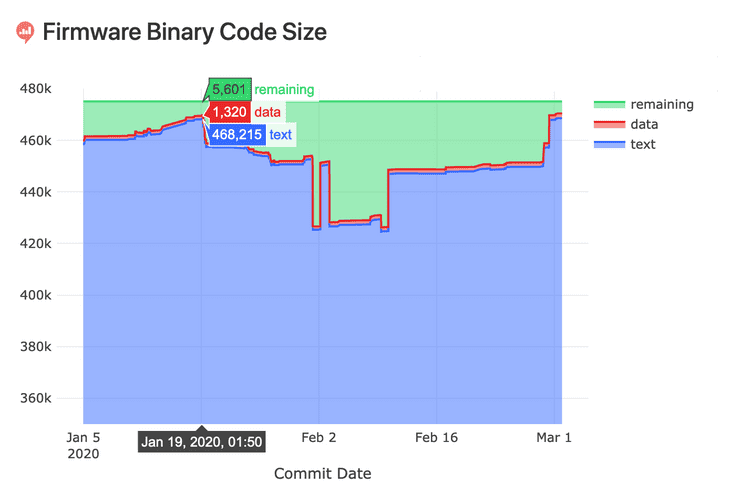
Memfault can automatically catch, triage, and fix issues on any hardware platform. In one of their blog posts Tracking Firmware Code Size they explain how to make sure you will never run out of code space when building an embedded application.
They started looking for an ideal solution that would provide them with the following four main features.
- Store data about each commit and build with a database.
- Look at historical code size data using visualizations.
- Calculate deltas between a commit’s code size and its parent’s.
- Estimate code size deltas between the master branch and a pull request build automatically.
In the end they also built their own custom solution based on PostgreSQL, Python, Heroku, Redash and GitHub Actions.
Conclusion
Various KPIs exist that allow you to gain insights into your application. As you can see tracking all those metrics can be hard and many different companies face the same problem. They come up with really great custom solutions but it requires time, resources and money to build, maintain and improve those implementations. Tracking all those metrics should not be hard. In the end it's really simple. You want to track a number and an optional unit, e.g.
- Code coverage: 89 %
- Bundle size: 1.2 MB
- Docker image size: 56.6 MB
- Number of dependencies: 237
- CPU usage: 87 %
- Benchmark: 134622 operations/second
- Build time: 3 mins 24 seconds
- Open pull requests: 13
- Average pull request size: 389 lines of code
- ...
You don't have to reinvent the wheel or start building your own custom data store and visualization. Start using seriesci.com today. It's easy to get started and simple to integrate into your daily workflow. It's free for open source projects.
In the past we had the same problem in every single project over and over again. We sat down and tried to find a general solution that would help us solving this problem. So that we can focus on building our application and don't have to worry about the KPIs. At the same time we tried to keep it really simple and very focused. It shouldn't be hard to integrate our product into your daily workflow and it also shouldn't create more work for you. It is a GitHub application that you can install with a few clicks. You don't have to create an extra account, you don't have to sign up. Simply add a POST request to your Continuous Integration and you're good to go. You can even try it from your local machine. Here is a simple cURL demo for sending one value to our API.
curl \
  --header "Authorization: Token c03dbf35-ccf9-456c-ab73-f621a9e4b36c" \
  --header "Content-Type: application/json" \
  --data "{\"value\":\"42 %\",\"sha\":\"${GITHUB_SHA}\"}" \
  https://seriesci.com/api/:owner/:repo/:series/one
Have a look at the live demo demo-docker-image-size. Here we track the docker image size. At the beginning we had a huge image of 832 MB and after some optimization we reduced it down to 10.5 MB.
Most of the custom built solutions only show the data when the change has already been committed to the master. That is too late. You want to see the data before the change makes into the master branch. It should be possible to see the master branch in the default view but also all your branches separately. Compare them to your master branch to catch regressions early during development. It's great for developers so they quickly see degradations.
You will end up with at least 50 different metrics that you need to have an eye on. It's easy to lose the overview of the whole system. You might have dedicated reportings for code coverage, for quantitative insights and for benchmarks. Your reporting might be distributed among business intelligence (BI) solutions, spread sheets, data analysis providers and custom solutions. It doesn't have to be this complicated. Keep all numbers in a single place.


 Mirco Zeiss is the CEO and founder of seriesci.