Logs are often known as one of the three pillars of observability. They are great for debugging code running in production. However they can also create a lot of data and noise. You want to have deep insight into your application but at the same time you only care about the information that matters. Thus logging libraries have many logging levels, e.g.
- panic (5)
- fatal (4)
- error (3)
- warn (2)
- info (1)
- debug (0)
- trace (-1)
You specify your global logging level and all logs with this level and greater will show up. For example, if you set your global logging level to warn (2) all logs with the levels error (3), fatal (4) and panic (5) will show up. That's great for production code because you can log only the most important things during normal operation. In case you've got a problem and have to dig deeper simply lower the logging level and all info and debug logs appear as well.
So how do you change the logging level for your production application that is running in a Kubernetes cluster?
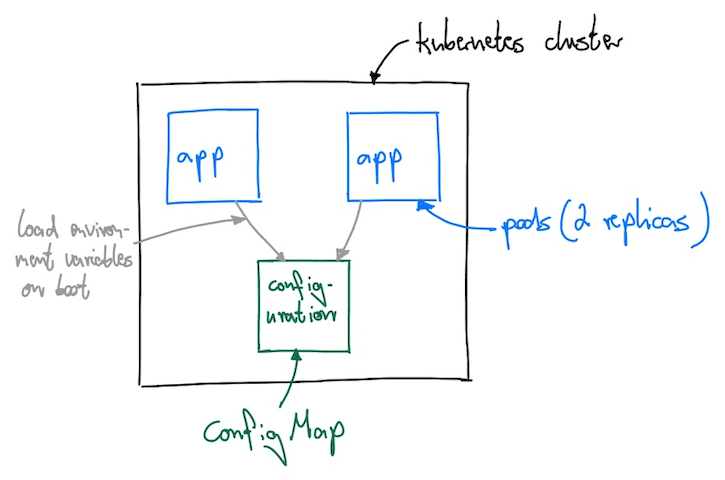
For this post we're using Go but the principles can be applied to any programming language. We assume you have multiple replicas of your application running to ensure zero downtime deployments. We're using a ConfigMap to store the current logging level. This ConfigMap is then translated into environment variables that the application reads during startup.
Save this very simple ConfigMap to a file called configmap.yaml.
apiVersion: v1
kind: ConfigMap
metadata:
  name: configuration
  namespace: default
data:
  log_level: info
Move it into your cluster by using kubectl.
$ kubectl apply -f configmap.yamlIt should appear on your Kubernetes dashboard.
At the moment our application doesn't know anything about this ConfigMap. We have to connect our application to it by adding some information to the deployment. Here we have a basic deployment and we add all the data starting at env:.
apiVersion: apps/v1
kind: Deployment
spec:
  template:
    spec:
      containers:
        - name: app
          env:
            - name: LOG_LEVEL
              valueFrom:
                configMapKeyRef:
                  name: configuration
                  key: log_level
It's really straightforward. We specify a new environment variable LOG_LEVEL that reads the value from our ConfigMap named configuration. Since our ConfigMap might have multiple key/value pairs we tell the deployment to use the log_level key. Now we have the environment variable LOG_LEVEL with the content info.
Next we have to read this environment variable inside our Go application. We're using os.LookupEnv to get the level as a string.
logLevel, ok := os.LookupEnv("LOG_LEVEL")
if !ok {
    panic("missing LOG_LEVEL environment variable")
}
We're using zerolog for logging but the principles are the same for any logging library. You have to parse the log level string to get the level as type of zerolog.Level. Then set the level globally so it is used throughout the whole application.
level, err := zerolog.ParseLevel(logLevel)
if err != nil {
    panic(err)
}
zerolog.SetGlobalLevel(level)

// use logging where needed
log.Debug().Msg("debug message")
log.Info().Msg("info message")
Here is a little diagram to illustrate the whole concept.
Now everything is ready and you're able to change the logging level on the fly. Simply change the content for the log_level key in your ConfigMap and apply it to the cluster. Then initiate a rolling restart so your pods will pick up the new environment variables. We're using make for automation.
.PHONY: debug
debug:
    # make sure you're in the right context
	kubectl config use-context ...
	kubectl apply -f configmap.yaml
	kubectl rollout restart deployment/app
On our local machines we keep the application outside the Kubernetes cluster. It makes debugging easier and restarts during development much faster since you don't have to create new containers. We simply use make to set the environment variable.
.PHONY: dev
dev:
	LOG_LEVEL="debug" \
	go run main.go
Start the application by running make dev.
Alternative options
When you google "changing the logging level in production" you'll probably find the article Changing the Logging Level at the Runtime for a Spring Boot Application. It's great for simple applications that don't run inside a Kubernetes cluster and consist of multiple replicas. The article describes three different solutions.
- An HTTP endpoint
- Watching a file for changes
- A dedicated admin tool
Let's have a look at these alternatives.
Using an HTTP endpoint
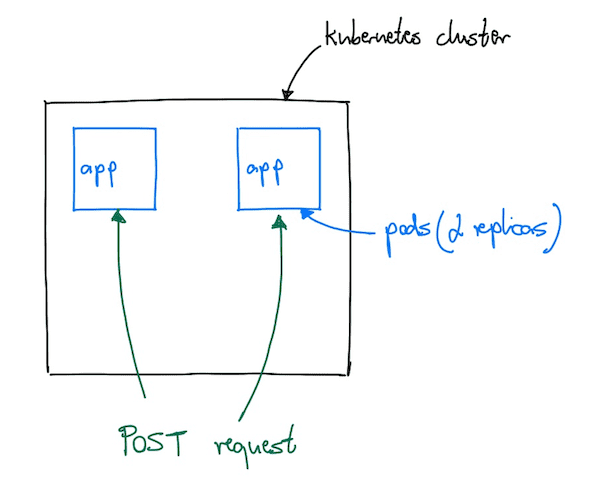
You could have an extra HTTP handler that accepts a POST request to change the logging level. I tried to illustrate this in the following picture.
That works great if you've got only one instance of your application running. As soon as you've got multiple instances you have to repeat the POST request again and again to make sure all instances have the same logging level. In Kubernetes your applications are usually not directly exposed to the internet. Normally you've got an ingress and a load balancer in front of your application. In this case you don't even have direct access to your pods and you cannot simply send a POST request to a dedicated pod to change the logging level. You could, of course, send the POST request many times and hope the load balancer will forward it to both instances. However that's not what we want. We want to have a deterministic behaviour.
So let's look at the second approach.
Watching a file for changes
Instead of posting a change request to your application the application could simply watch a file for changes indefinitely.
You'd use a ConfigMap again and set the content similar to the following.
apiVersion: v1
kind: ConfigMap
metadata:
  name: logback-configmap
data:
  logback.xml: |+
    <?xml version="1.0" encoding="UTF-8"?>
    <configuration>
      <include resource="org/springframework/boot/logging/logback/base.xml"/>
      <logger name="org.springframework.web" level="DEBUG"/>
    </configuration>
Instead of using environment variables we're using a volume in this case. Our application then reads the data from this virtual file. It polls the file for changes and whenever a change is detected the new logging level is activated. Updating the ConfigMap and setting a new level works in the same way as described above.
The downside here is the polling mechanism. The application watches the file for changes indefinitely even when you don't want to make any changes. You could, of course, increase the timeout to, let's say, one minute but then you have to wait for one minute before a change happens. That's definitely too long in case you really need it and want to debug an issue in production.
Installing an administration tool
The third option is some sort of administration tool like Spring Boot Admin. Since it requires much more bells and whistles apart from your normal application we won't go into more details here.
Conclusion
We've have shown several ways to change the logging level of your application running in production inside a Kubernetes cluster. You could use a simple POST request, a file watcher or a ConfigMap. It always depends on your infrastructure and how you run your application. We really like the idea of having a ConfigMap that's responsible for all the configuration of our application. In case we need to change something we update the ConfigMap and tell our cluster to create new instances which will translate the ConfigMap into environment variables.


 Mirco Zeiss is the CEO and founder of seriesci.